Volume check, error analysis and system info in Areca systems

Bad-block scrubbing, error logging and hardware monitoring with the practical Areca GUI

Note

The screenshots shown here are from an Areca ARC-1886-8X RAID controller and the ARC-8050T3-8 Thunderbolt system with built-in RAID controller.

In principle, however, the GUI display and range of functions in all currently available SATA, SAS and tri-mode RAID controllers and systems from Areca are as shown here.

Check Volume Set

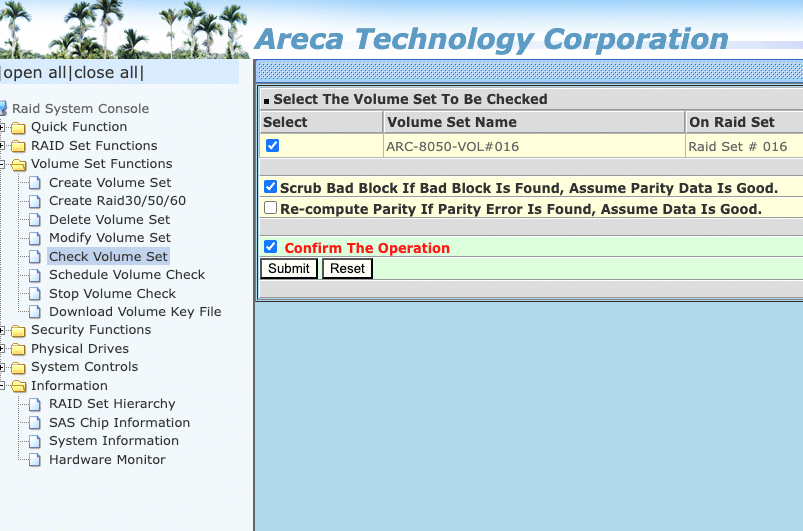
In the Volume Set Functions menu item, you will find the Check Volume Set. This allows you to check a volume for errors. Optionally, you can also repair blocks on the disk surface at the same time.

Under “Re-compute Parity If Parity Error Is Found, Assume Data Is Good.”, the GUI also offers you an option to perform a parity recalculation. However, caution is advised here. First, only run the “Scrub Bad Block If Bad Block Is Found, Assume Parity Data is Good.” to find damaged blocks.

ARC_Volume_Check_Start1
This is what the GUI view for initiating the volume check looks like. The check is performed immediately afterwards.
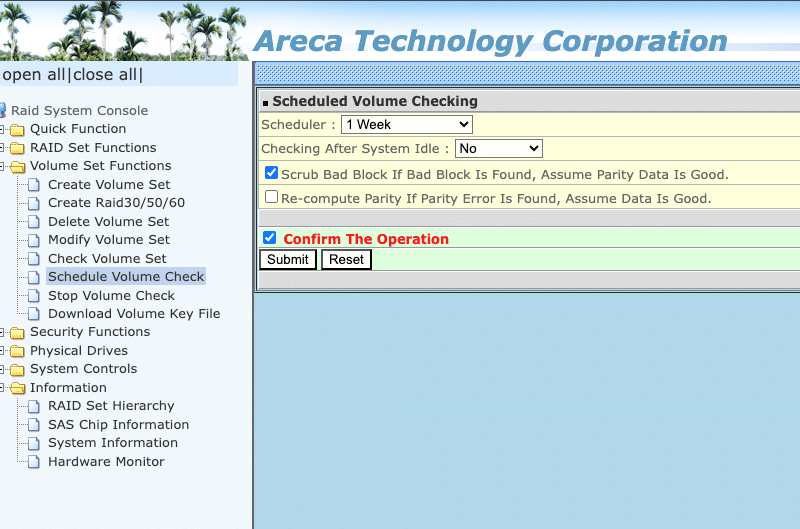
ARC_Volume_Check_Schedule2
The graphical user interface offers you the option of carrying out a weekly check in “Schedule Volume Check”. This allows you to prevent errors very effectively.
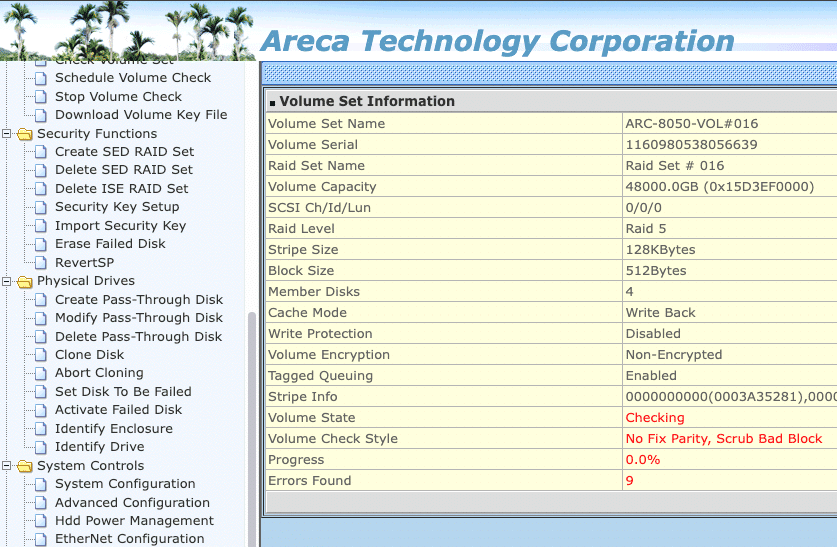
ARC_Volume_Check_Volume_Set_Inf3
If you click on the name of the volume set in the RAID set hierarchy, you can follow the progress.

System Information

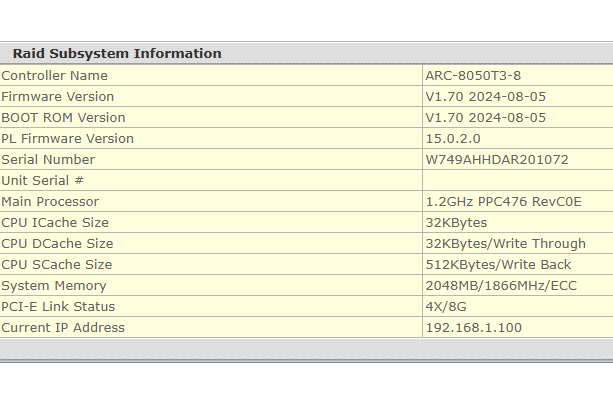
Under Information and the System Information submenu, you can view the data for your system or controller.

Among other things, you will find the model name, the current firmware version, the boot rom version and the current IP address.

Areca_ARC_System_Information4
An example of a GUI system information page.

SAS Chip Information

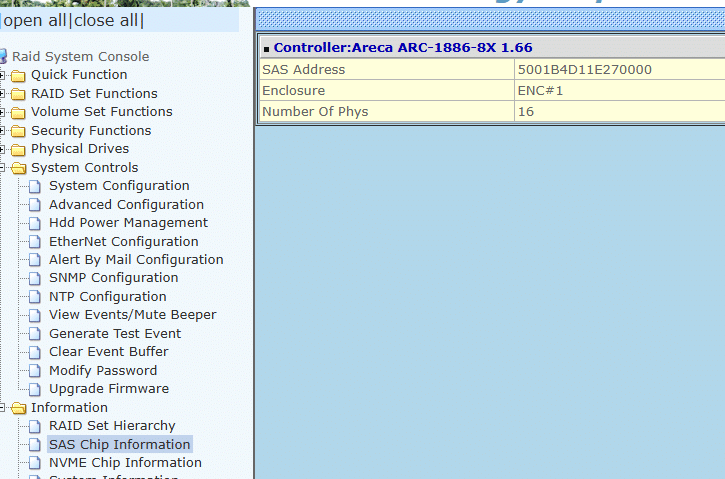
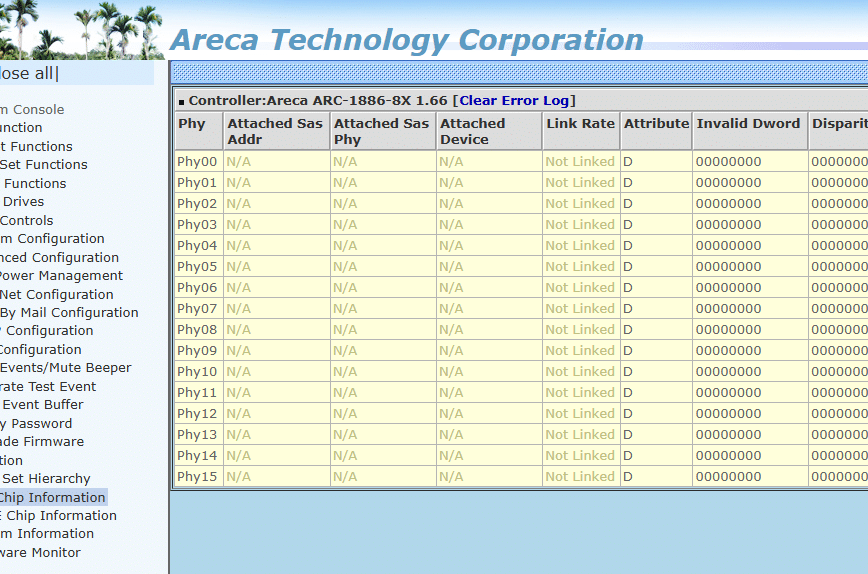
Under SAS Chip Information you will find indicators to assist you in troubleshooting. High numerical values in the corresponding sections indicate possible errors. Among other things, you can view the following error types there. 

  • Errors on the drives
  • Faulty cabling
  • Faulty ports
  • Faulty backplane
ARC_SAS-Chip-Information5
Under “SAS Chip Information” you can access the corresponding submenu.
ARC_SAS-Chip-Information_(clicked)6
If you click on the blue controller name, the counter overview opens.

Hardware Monitor

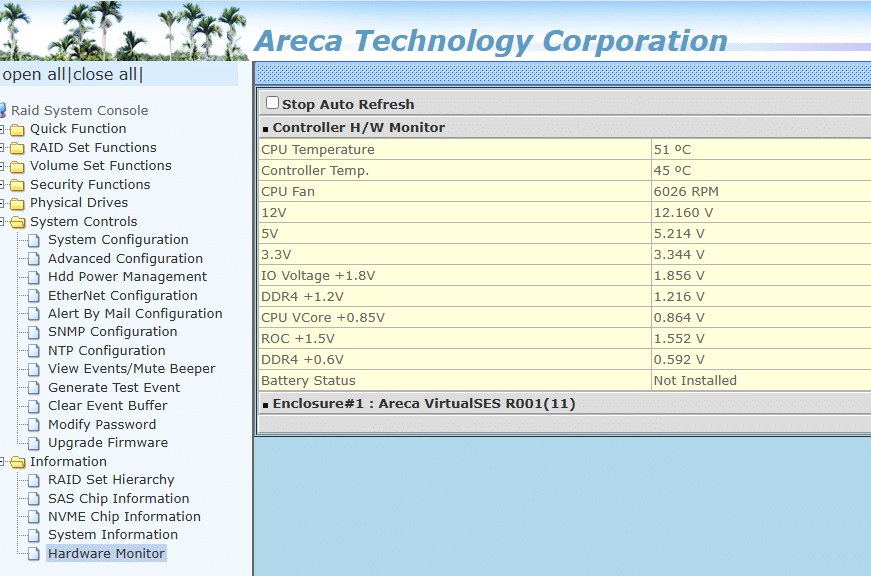
The available sensor data, such as the temperature of the CPU and controller, the fan speed and various voltages, are first displayed in the GUI under “Hardware monitor”.

It should be noted that the measured values in the right-hand column should not fall below the reference values in the left-hand column. The system voltages (12 V, 5 V and 3.3 V) are particularly important here.

If a battery is installed in the system, its charge status is also displayed here.

ARC_HW_Monitor7
You can use the hardware monitor to check the controller's sensor data.

Test HDD/SSD internally

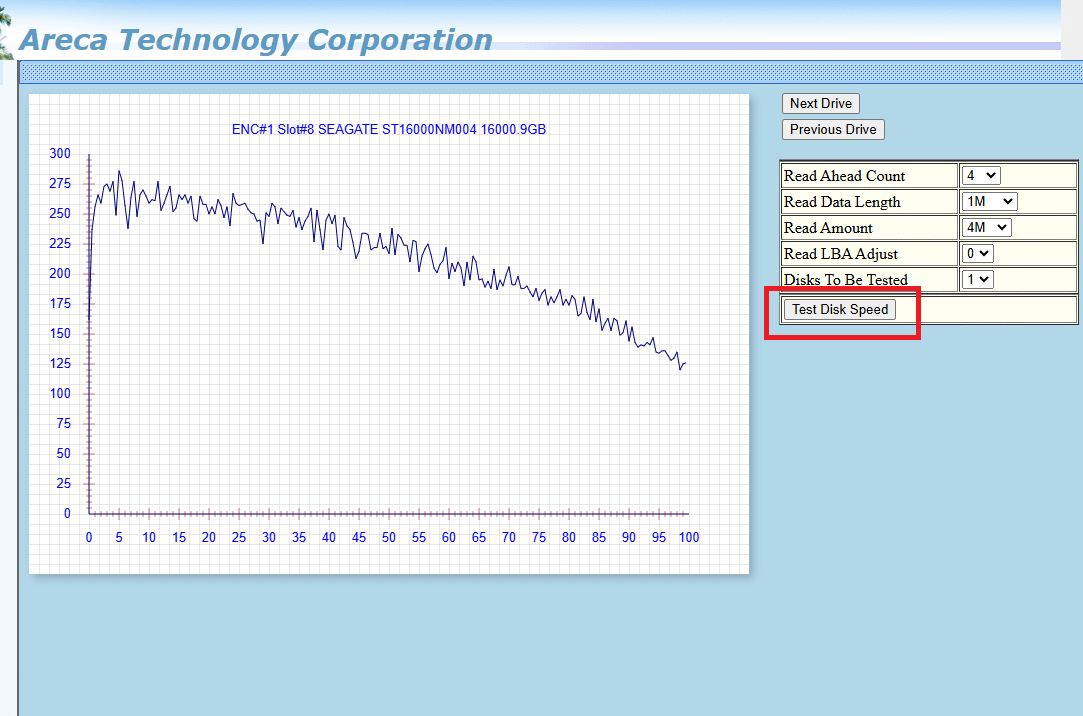
The Areca GUI displays the performance values of a hard disk or SSD in the internal slot overview. This allows you to locate an HDD/SSD with poor performance.

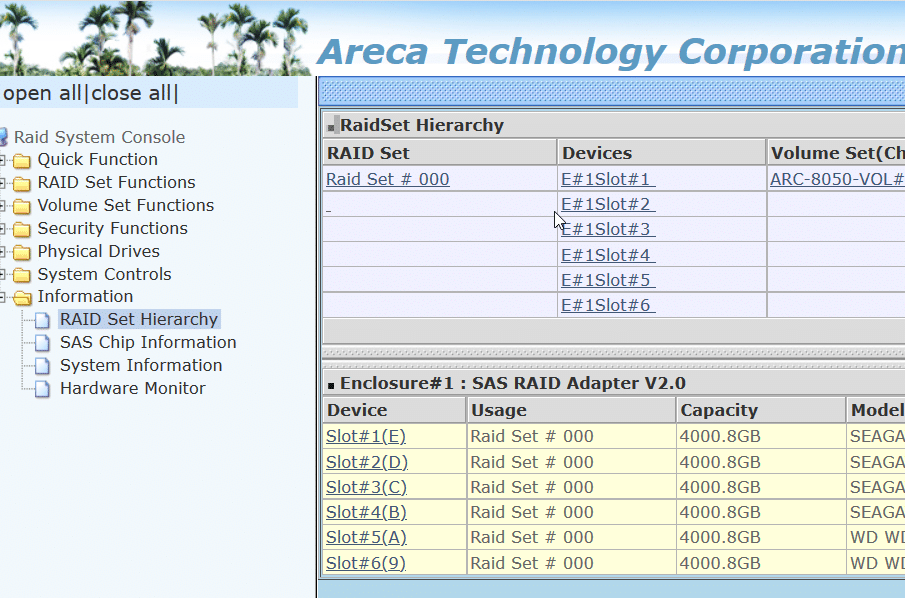
To do this, click on RAID Set Hierarchy in the respective drive slot.

ARC_RAIDSet_Hierarchy8
Click on “RAID Set Hierarchy” under “Information”.
ARC_HDD_Show_Result_SlotX_Speedtest9
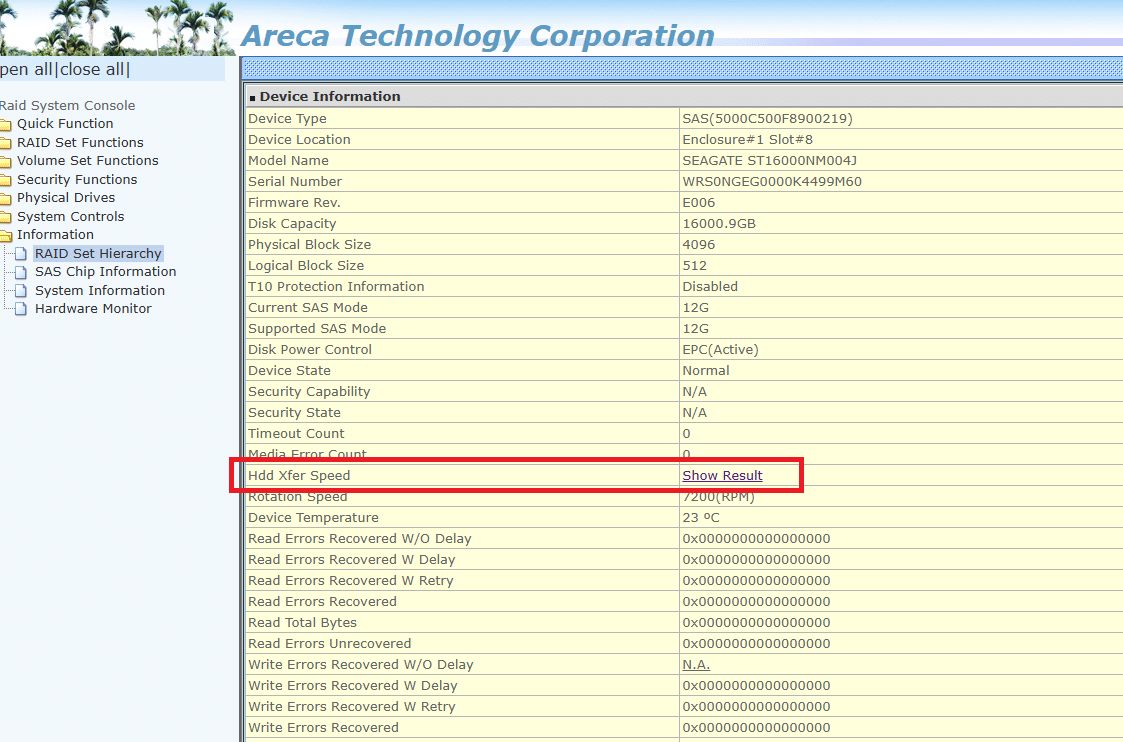
If you click on the drive you want to examine in the slot overview, you will be taken to the “Device Information” of the HDD.
ARC_HDD_Speedtest10
After clicking on “HDD Xfer Speed” and “Test Disk Speed”, a characteristic measurement diagram is displayed.

Any questions?

KB
Konrad Beyer
Technical Support

Our technical manager has a comprehensive knowledge of all storage and server topics.